Purpose
Learn to perform experiments using LabPRO's Motion Detector and analyze data using the Video Analyze application, mastering data analysis methods and using data for further calculations and interpretation.
Measurement of acceleration due to gravity from a motion detector.
 |
| (Image. A1). Data captured by Motion Detector |
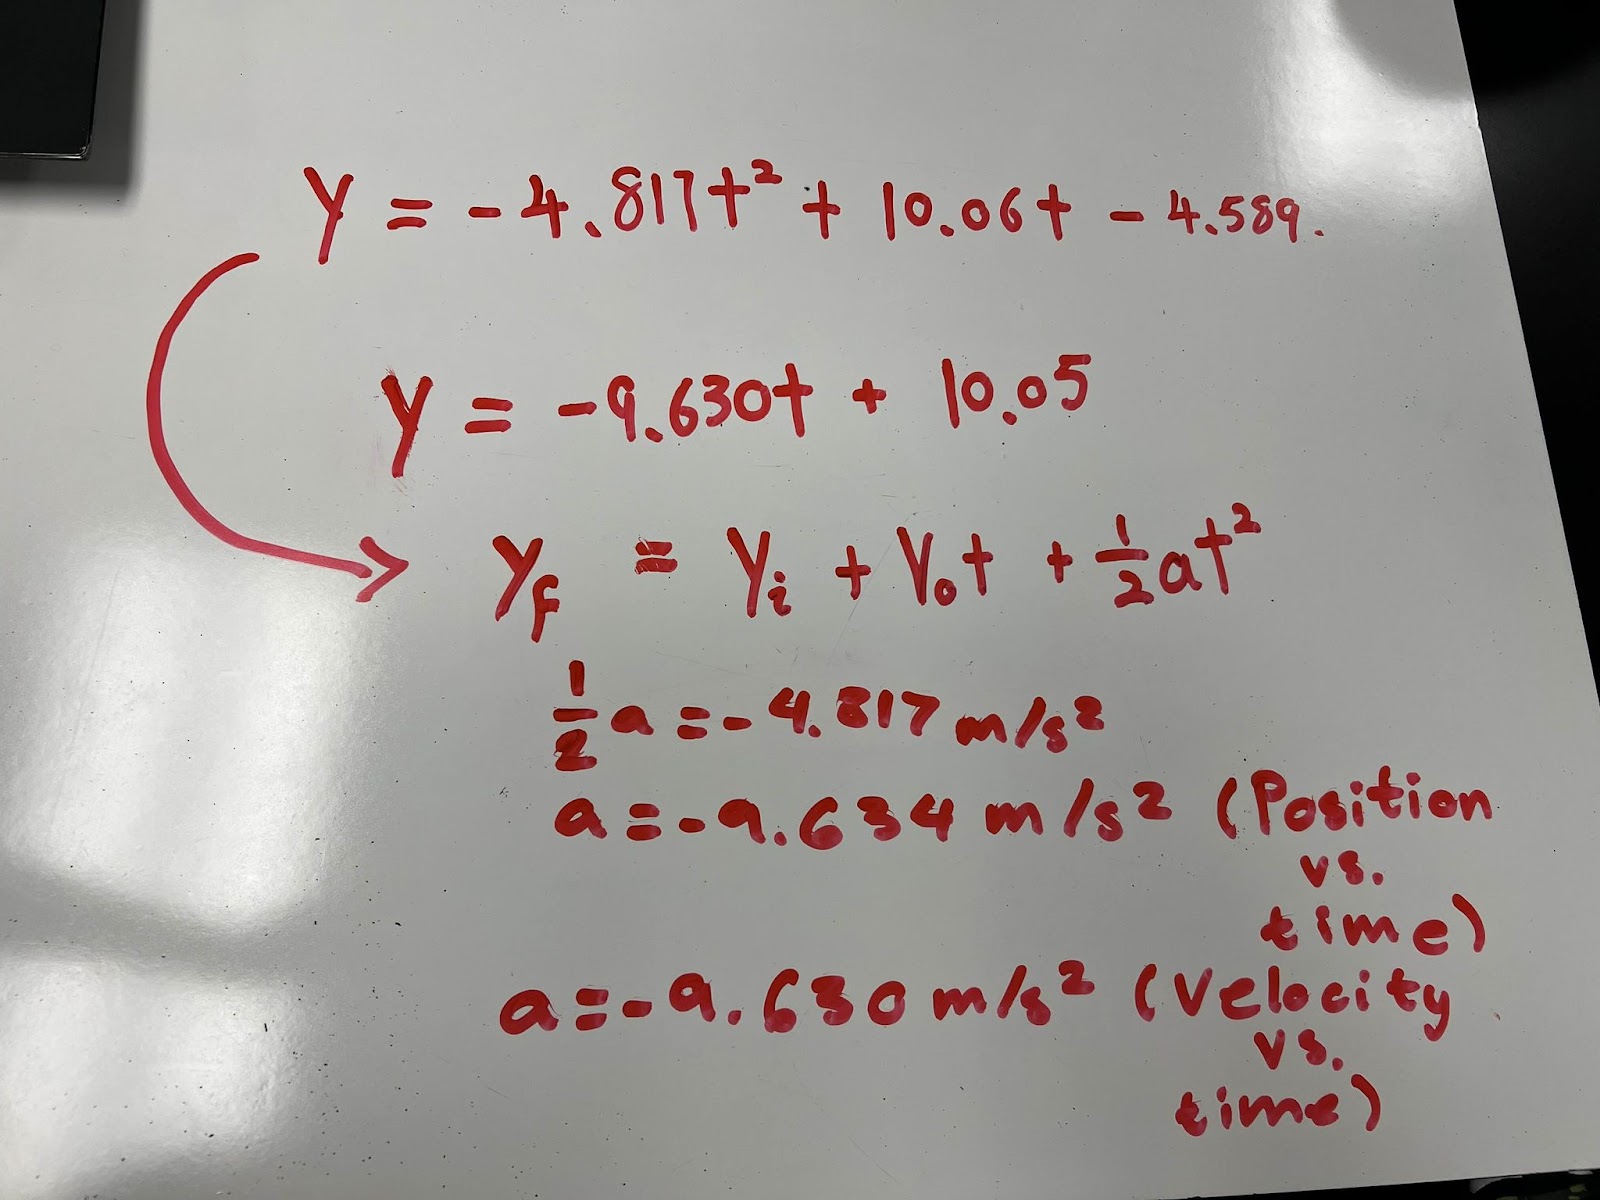 |
| (Image. A2). The process of calculating acceleration |
 |
| (Image. A3). The process of calculating the standard deviation of the gravitational acceleration of a motion detector |
What did you measure?
using LabPRO to measure position and velocity as functions of time.
How did you measure it?
1. Use the Logger Pro software application and set it up to run my experiment on the Motion Detector.
2. The motion detector is mounted on a rod holder more than 1.5 meters above the ground and an object is placed underneath it.
3. Turn on the Motion Detector to detect the data, then let a ball fall freely.
4. Using the Logger Pro program again, pull up the position vs. time and velocity vs. time graphs. (Image. A1)
5.Finally use the data from the graph to calculate the acceleration
What were your results?
see the (Image. A2) $y = -4.817t^{2}+10.06t-4.589$ and $v = -9.63t + 10.05$. The acceleration calculated by me and my teammate using this data is -9.63$\frac{m}{s^{2} } $
What was the standard deviation of your result?
see the (Image. A3), Using what I learned in class the standard deviation is = 0.13$\frac{m}{s^{2} } $
Measurement of acceleration due to gravity from Video Analysis
 |
(Images. B1). Data captured by Video Analysis |
.jpeg) |
(Images. B2)The process of calculating acceleration using Video Analysis
|
 |
| (Image. A3). The process of calculating the standard deviation of the gravitational acceleration of video analytics. |
What did you measure?
Measurement of position and velocity versus time for horizontal and vertical motion using video analytics.
How did you measure it?
1. Find a ball. (I didn't have one at home, so I used a stuffed toy instead).
2. Record a video of throwing the object in a projectile motion across an open span.
3. Use the QR code provided by the professor to open Video Analysis, then upload the recorded video
4. Use Video Analysis to examine the motion data of the object I threw.
5. Display the horizontal and vertical motion data in Video Analysis. (Images. B1)
6. Finally use this data to calculate the acceleration
What were your results?
see (images B2). The data obtained are :
$y(t) = -4.25t^{2} + 5.195t-0032$
$X(t) = 1.206T+0.054 $
$V{\scriptsize y} =-7.372t+4.584$
$\Delta x = 1.33s$
Use this data to calculate acceleration = -8.5$\frac{m}{s^{2} } $ and -7.372$\frac{m}{s^{2} } $ (Since I didn't do it professionally enough the data isn't very accurate)
What was the standard deviation of your result?
see the (Image. B2), Using what I learned in class the standard deviation is = 0.36$\frac{m}{s^{2} } $
Write-up on measurement variability.
Find the % difference between the results of the two
experiments.
The percentage difference between my own data of -9.63 and -8.5 is 12.46% and the percentage difference between the average data of -9.13 and -9.54 is 4.39%
Do your measurements agree within the uncertainty determined
from the standard deviation? Yes, the measurements agree within the uncertainty because there is an overlap in the range
[−9.49,−9.41].
What measurements have uncertainty when using the motion
detector?
When using motion detectors, there is uncertainty in the measured values of position, velocity, and this leads to differences in the acceleration measured by each team, which can be caused by limited detector accuracy, unstable signals reflected from the surface of the object, external interference, and possibly human error.
What measurements have uncertainty when using video
analysis?
Likewise, there is uncertainty in the position, velocity and measurement values, which leads to differences in the acceleration measured by each team, due to a number of reasons, including frame rate (not smooth enough for video recording), pixel accuracy, manual marking errors, and the influence of the camera angle.
Estimate the uncertainty for each of the measurements in the
first and second experiments.
video Analysis Data: $-9.13\frac{m}{s^{2} } \pm 0.36\frac{m}{s^{2} }$
Motion Detector Date: $-9.54\frac{m}{s^{2} } \pm 0.13\frac{m}{s^{2} }$
Use the techniques discussed today to do uncertainty
propagation for your measurements. (Hint watch videos)
Uncertainty propagation:$-18.67\frac{m}{s^{2} } \pm 0.49\frac{m}{s^{2} }$
Do the measurements agree within your estimated uncertainty?
Which of the measurements is more useful and why? I think the data from experiment 1 motion detector is more helpful because its uncertainty is only 0.13, in other words, it is more accurate, and the experiment is very simple, unlike experiment 2, which is more complicated because of the parabolic motion, and there are a lot of uncertainties that affect the accuracy of the data.


.jpeg)


Comments
Post a Comment