 |
| Graph of experiments and calculations |
 |
| Data from experiments |
 |
| formula was used to calculate the height |
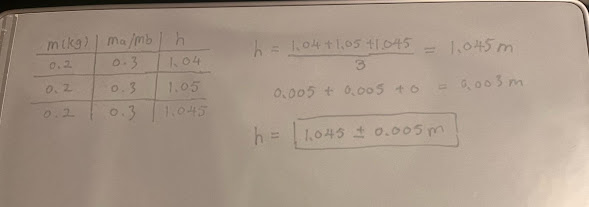 |
| Calculation uncertainty |
Where do the two curves match?
- From the graphs of the data, it can be seen that when the central mass M<0.09, the experimental data are in good agreement with the theoretical curve ( predicted equation).
Where do the two curves start to diverge from one another?
- When M > 0.1 kg, the experimentally measured vertical displacement is significantly larger than the theoretically predicted value.
What does this tell you about the system?
- Show that the theoretical model (assuming no friction and no elasticity) is only applicable to the small mass case and that the actual system has pulley friction or rope elasticity effects.
What are the limitations on the accuracy of your measurements and analysis?
- There is an uncertainty of ±0.005 m in the height measurement. (This was obtained by me and my team by measuring the same mass and then measuring it several times)
- I think there are other factors that are overlooked, including pulley friction, rope quality, elastic deformation
What will you report to your supervisor? How does the vertical displacement of an object suspended on a string between two pulleys depend on the mass of that object?
- Vertical displacement increases with increasing mass. The theoretical model significantly underestimates the displacement values when M > 0.1 kg. The reason for this is hypothesized to be that pulley friction or rope elasticity was not included in the model. It is recommended that the effect of friction parameters be further investigated
Did your measurements of the vertical displacement of object B agree with your initial predictions? If not, why? State your result in the most general terms supported by your analysis.
- significant differences when M ≥ 0.1 kg. Possibly the ideal model only applies to small masses; real systems need to take friction and elasticity corrections into account.
Do the pulleys behave in a frictionless way for the entire range of weights you will use? How can you determine if the assumption of frictionless pulleys is a good one?
- The deviation of theory from experiment for larger masses may be due to friction in the action of the
What information would you need to apply your calculation to the walkway through the rain forest?
- Length of the bridge (L), weight the bridge can support, rope mass. The friction of the bridge, and the weather


Comments
Post a Comment